Webhook Delivery History - Track and Audit Deliveries
The Webhook delivery history tab records every webhook the system has sent for your store — successful or not — so you can monitor operations and investigate incidents.
Overview
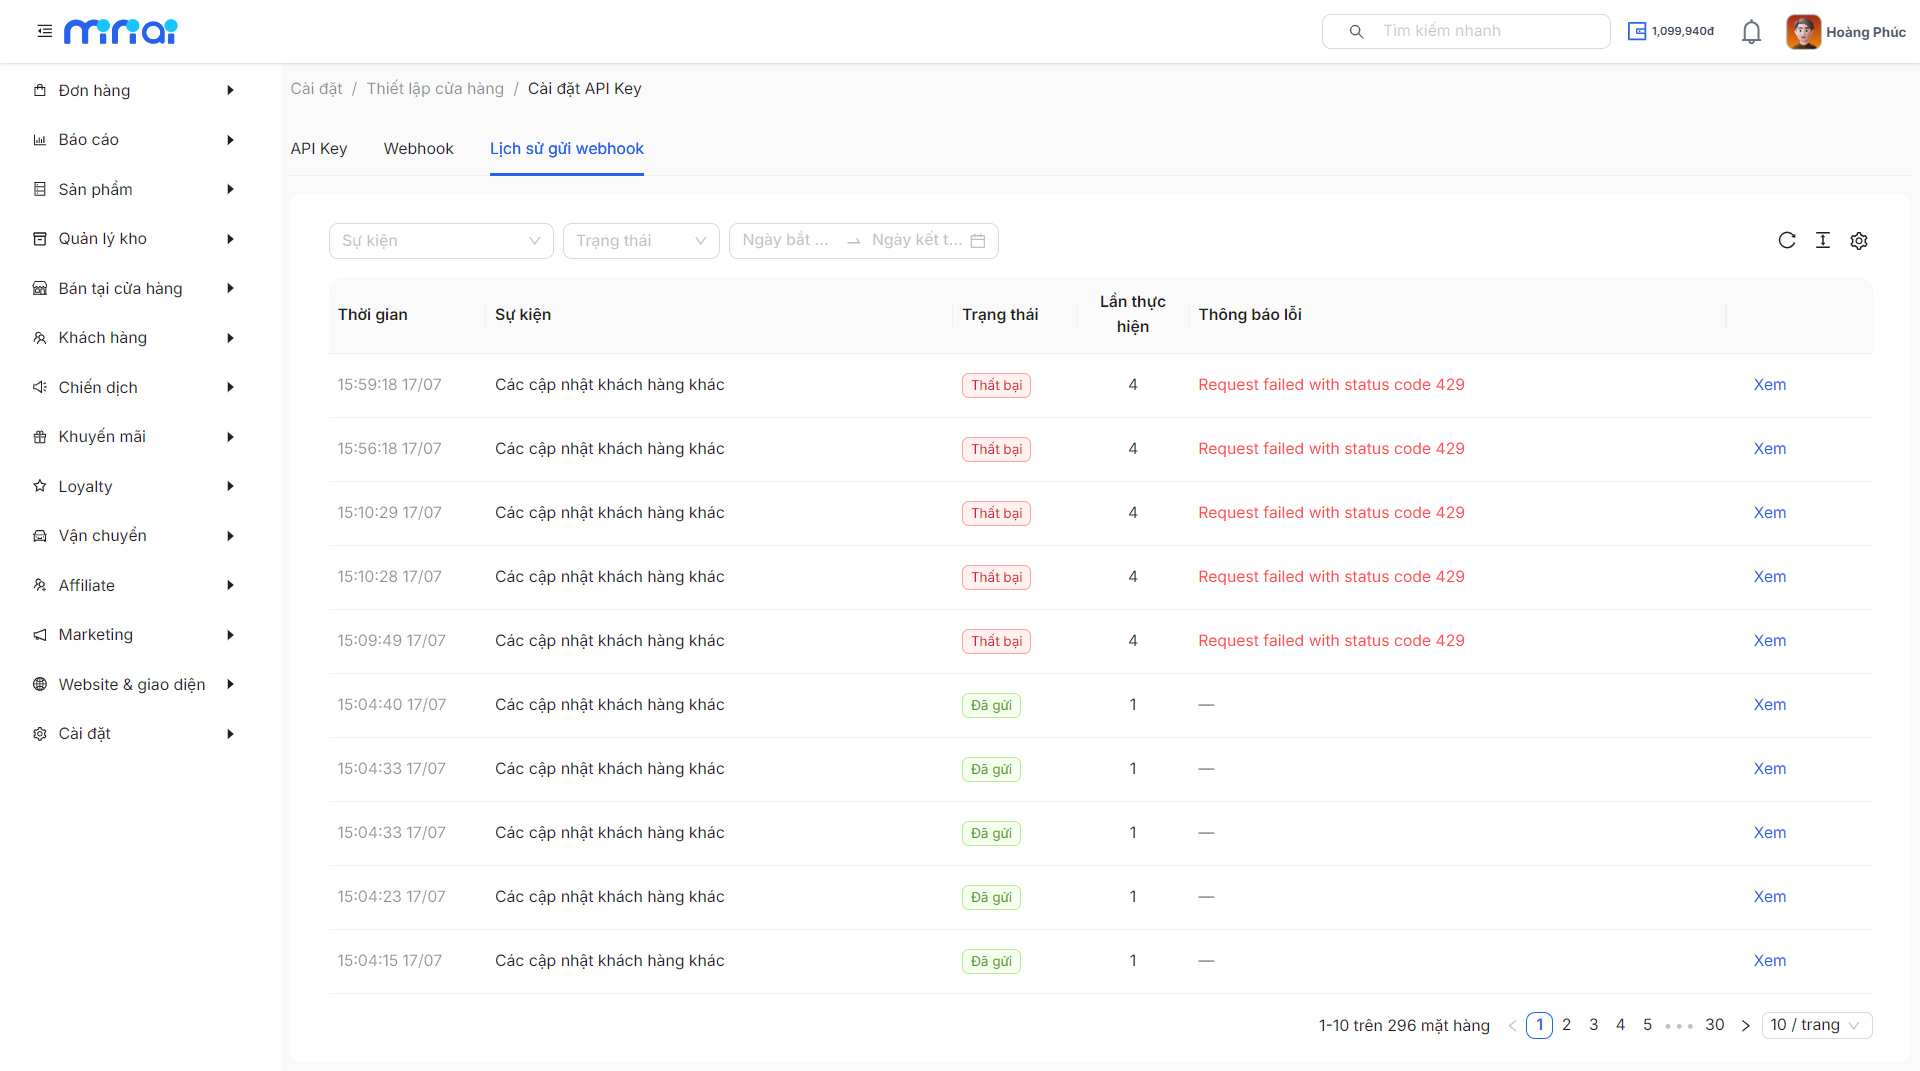
Go to Settings → Store Settings → API Key and select the Webhook delivery history tab. The list shows the following columns:
| Column | Meaning |
|---|---|
| Time | When the event was recorded |
| Event | Event type (e.g. Order created, Phone number updated...) |
| Status | Pending / Delivered / Failed |
| Attempts | How many times the system has sent it (including retries) |
| HTTP status | Response code from the receiving server on the latest attempt |
| Action | A View button to open the details |
Filters
The list can be filtered by:
- Event — pick a specific event type
- Status — Pending / Delivered / Failed
- Date range — from date to date
Status meanings
| Status | Meaning |
|---|---|
| Pending (orange) | Queued, or waiting for the next retry slot |
| Delivered (green) | The receiving server responded with a 2xx code |
| Failed (red) | All 4 attempts were exhausted without success |
When a delivery fails (error response code, 10-second timeout, connection refused...), the system automatically retries on a backoff schedule: after 5 minutes → 30 minutes → 3 hours. There are at most 4 attempts in total; if all fail, the record turns Failed.
Viewing delivery details
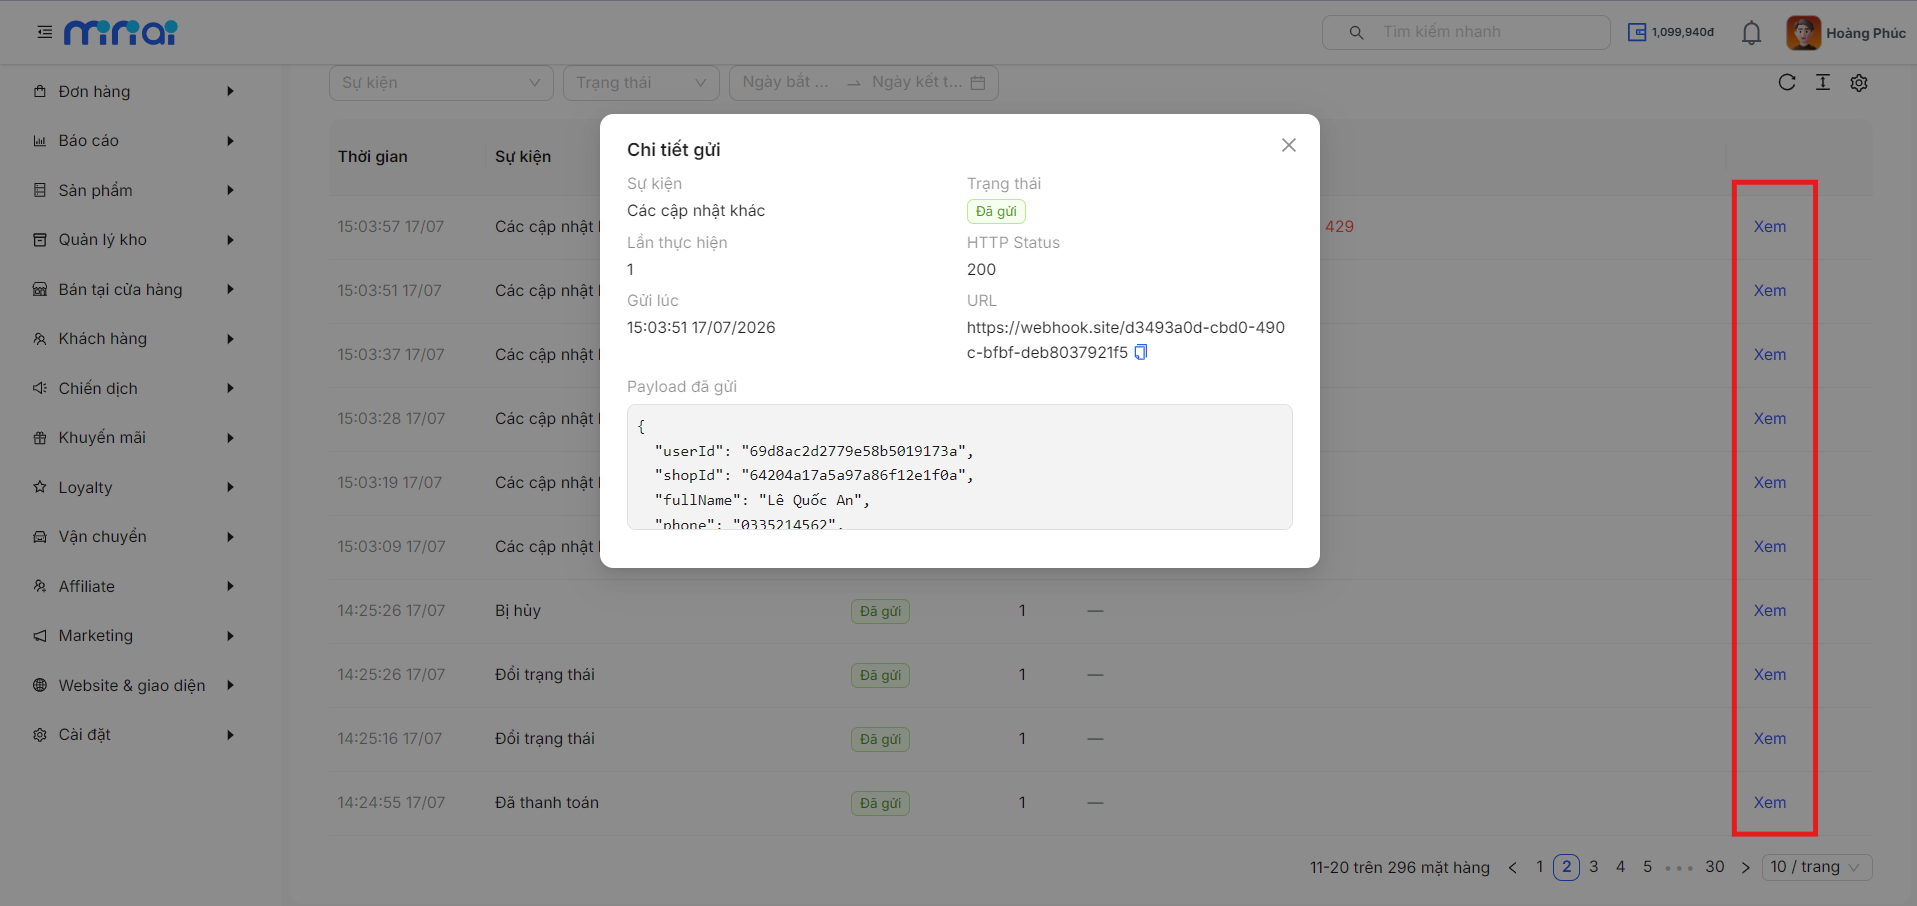
Click View on any row to open the detail window, which includes:
- Event type and status
- Attempt count and HTTP response code
- Time of successful delivery
- The URL the request was sent to
- The full JSON payload — exactly the
datasent to the receiving server - The most recent error message (if any)
Troubleshooting common issues
| Symptom | Common cause | How to fix |
|---|---|---|
| Many Failed records with an empty HTTP status | Receiving server unreachable (down, wrong domain, blocked by firewall) | Check the receiving server; use the Check button on the Webhook tab to confirm the URL is alive |
| Failures with 401 / 403 | The receiving server rejected authentication | Cross-check the header / Secret configuration on both sides |
| Failures with 404 | Wrong endpoint path | Re-check the URL on the Webhook tab |
| Failures with 429 | The receiving server is rate-limiting requests — too many events sent in a burst exceeded its allowed rate | Raise the rate limit on the receiving side for the webhook route, or process asynchronously (return 200 immediately, then queue the work) so bursts of events don't get throttled. The system currently retries on a fixed schedule (5 min → 30 min → 3 hours) — it does not honor a Retry-After header |
| Failures with 500 | Processing error on the receiving side | Inspect the payload in the delivery details and reproduce the error on the receiver |
| Pending status for a long time | Waiting for the next scheduled retry (up to 3 hours) | Wait for the retry, or fix the receiving server before the next attempt |
| No records appear at all | The webhook is not Activated, or the event is not subscribed | Open the Webhook tab and check the Activate switch and the selected events |
The payload in the detail window is exactly the data that was sent — sharing it with the receiving team is the fastest way to determine which side the problem is on.
Manual resending of a failed record from the UI is not supported yet — the system only retries automatically on schedule. If a record has Failed (all 4 attempts used), reconcile that event through the corresponding data API.